Kubernetes

GitOps Demystified

Yesterday I saw a zinger of an article on a topic I’ve thought about a lot in the last few years: GitOps.

From the title, “GitOps is a Placebo,” I expected a post on the good and bad of what Steve had seen from GitOps with an ultimately negative overall sentiment. However, he takes a cynical view of the entirety of GitOps saying that really it “has no new ideas of substance.”

I understand some of the points he makes around marketing hype but I do think there is some merit if we distill it down to its principles (which, as he says, are not new) and how they are applied in a set of specific scenarios with a certain set of tools and therefore communities. One thing that has been clear to me over the last couple of years is that GitOps confuses a lot of people. Some think they are already doing it by checking in code to a repo and others think they can sprinkle in a few tools to solve all of their CD problems.

I’ll try to give my view of what GitOps is and assess some of its pros and cons. I’ll also try to give a bit more insight into what it looks like to:

  • Implement GitOps in the context of the CNCF (Kubernetes, Flux, Argo, etc.)
  • Use a GitOps pattern, which, as Steve mentions, has existed in many places for many, many years as Continuous Delivery and DevOps patterns

“GitOps” is coined

Let’s start with a little bit of the origin story…

“GitOps” was coined as a term for a set of practices that can be used to continuously deliver software. This term was first used by Alexis Richardson in 2017 as a way to define the patterns and tools the teams at Weaveworks used to deliver software and manage their infrastructure. Namely, they used declarative definitions of infrastructure via Terraform and applications via Kubernetes YAML that are versioned in a Git repository branch, then submitted for approval and applied by automation.

Kubernetes configs were applied by a tool they built, called Flux, that would poll a Git branch and ensure that any changes to the repo were realized in their clusters. The team took things one step further after deployment to mitigate config drift. They used tools (kubediff and terradiff) to check the configuration in their repos and compare it to their running infrastructure. When a discrepancy was found they would get alerted (via Slack) to out-of-band changes to the system so they could rectify them.

The diagram below shows what the implementation of the pattern and tools looked like at Weaveworks in 2017. They used Flux as an “Actuator” to apply config to Kubernetes APIs and kubediff as a “Drift Detector” to notify in Slack when drift occurred.

If you abstract away the specific tools used you see a pattern like this:

The evolving GitOps tool landscape

GitOps tools have evolved since 2017 with many more vendors implementing the “Deployment System” box and the creation of new sub-systems that aid with things like managing configuration (Helm/Kustomize/etc) and canary releases. One big change in the architecture of the pattern is that the “Actuator” and “Drift Detector” components have been unified into a single system that does both tasks. Additionally, drift detection has been extended to remediation where if config drift is detected, the “Deployment System” resets any changes to what is stored in the Git repository.

To that end, we can simplify things in our pattern and say that a GitOps “Deployment System” has the following attributes:

  • Polls a Git repo to detect changes
  • Mutates the infrastructure to match the committed changes
  • Notifies or remediates when config drift occurs

What are the underlying capabilities that the pattern leverages?

While the term “GitOps” was new in 2017, as the initial article states: “There is prior art here.” The general pattern described above has been in active use among many config management communities through things like Chef, Puppet, and Ansible’s server components. Dr. Nicole Forsgren, Jez Humble and the DORA team have shown how the attributes above and many other key capabilities have helped enterprises ship better software for years. Side note: this content from the team is EXCEPTIONAL.

Let’s break down some of the tradeoffs of GitOps. I’ll frame these broadly in the terms used by DORA in their DevOps Capability Catalog:

  • Version Control and Streamlined Change Approval – Use Git repos as a way to store the state you want your system to be in. Ensure that humans can’t commit directly to the Git repo+branch and changes must receive a review before merging.
    • Pros
      • Changes become transactional
      • Rolling back changes can be done by reverting commits (you hope)
      • Each change has an audit trail with metadata about the contents, time, author, reviewer
      • Pull requests provide a place for discourse on the proposed changes
      • PR can hold the status of the change as it progresses through the system
      • Use existing RBAC applied in the repo for who can commit/merge/review etc.
    • Cons
      • Break glass scenarios can become more cumbersome
      • Roll backs can be difficult
      • Not all roles (infra/security/etc) are comfortable with Git
      • Code level RBAC isn’t always the correct granularity or UX for deployment approvals
  • Deployment Automation – When changes are merged into the correct branch, an “Actuator” detects the change by polling for new commits. The “Actuator” decides what changes need to be made to realize the desired configuration and then calls APIs to bring the system into the right state.
    • Pros
      • The change authors nor the CI system need access to the APIs, only the actuator does.
      • “Actuator” can continually reconcile the state of the system
    • Cons
      • “Actuator” has to be kept up-to-date as the platform it is deploying to evolves
  • Proactive Failure Detection – There is a subsystem in the “Deployment System”, the “Drift Detector”, which reads from the Git repo and the imperative APIs to detect whether the configuration doesn’t match the current state of the system. If there is a discrepancy, it sends a notification to administrators so they can rectify it.
    • Pros
      • Changes made out-of-band from the deployment system are flagged for inspection and/or remediation.
    • Cons
      • If multiple deployment systems have been wired up or manual changes are required, they can create false negatives.

GitOps with Jenkins and GCE? Please Vic, no.

Okay, so we’ve broken down some of the key capabilities. Let’s see if we can take some tooling from pre-Kubernetes times to implement a similar “Deployment System”.

As most of you know, I’m quite a fan of Jenkins. Let’s see if we can use it to follow the GitOps pattern but rather than deploying to Kubernetes, let’s deploy a set of VMs in Google Compute Engine. Since Jenkins is a relatively open ended CI system and has very strong polling and Git repo capabilities, this should be a breeze.

First we’ll create a GCE Instance and gather its configuration:

# First create the instance
gcloud compute instances create jenkins-gce-gitops-1

# Now export its config to disk
gcloud compute instances export jenkins-gce-gitops-1 > jenkins-gce-gitops-1.yaml

The resulting file should contain all the info about your instance:

Next, we’ll create a Jenkins Job to do the work of the “Actuator” above. We’ll set it to poll the source code repository every minute for changes:

Now, we’ll write a Jenkinsfile that will take the configuration from our repo and apply it into the Google Compute Engine.

pipeline {
    agent any
    stages {
        stage('Actuate Deployment') {
            steps {
                sh '''
                   cd instances
                   for instance in `ls`;do   
                      NAME=$(basename -s .yaml $instance)
                      # Update instance config
                      gcloud compute instances update-from-file $NAME \
                                               --source $NAME.yaml
                   done
                '''
            }
        }
    }
}

This script will now trigger on each commit to our repo and then update the configuration of any instances that are defined in the instances folder.

Next, we need to setup our “Drift Detector”, which will be implemented as a second Jenkins job. Instead of polling the Git repo every minute, I’m going to have it run every minute regardless of whether there was a change or not.

In the case of the “Drift Detector,” we are going to write a small script to ensure that the config in Google Compute Engine matches our config in the repo. If not, we’ll send an email to report the issue.

pipeline {
    agent any

    stages {
        stage('Detect Drift') {
            steps {
                sh '''
                   cd instances
                   for instance in `ls`;do
                      NAME=$(basename -s .yaml $instance)
                      # Export current config
                      gcloud compute instances export $NAME > $NAME.yaml
                   done

                   # Exit 1 if there is a difference in the config
                   git diff --exit-code
                '''
            }
        }
    }
    post {
        failure {
            mail to: "viglesias@google.com",
                 subject: "[ERROR] Drift Detected",
                 body: "Click here for more info: ${env.BUILD_URL}"
        }
    }
}

With that in place we now have our “Drift Detector” doing its job. It will notify us if anything changes with that GCE instance. We’ll test this by updating a field on our instance out-of-band of the “Deployment System”, like setting the Deletion Protection flag via gcloud:

gcloud compute instances update jenkins-gce-gitops-1 --deletion-protection

Within a minute or two we should see an email from Jenkins telling us about the drift:

When we click the link it sends us to the build itself where we can see the logs showing what the config drift was:

What if we wanted to automatically remediate issues like this? In the case of the system built here, all you’d need to do is set up the “Actuator” job to run when new changes come in AND periodically (like the “Drift Detector”).

Now the “Actuator” will correct any differences in config, even if there weren’t any new commits.

Let’s take a look at the system we have built with Jenkins:

Wait a second! Jenkins, API driven VM management and e-mail have been around FOREVER!

So why is everyone talking about GitOps?

GitOps shows an opinionated way to implement a long standing pattern with a specific set of tools (flux/ArgoCD/ConfigSync/etc) for deploying to a specific type of infrastructure, namely Kubernetes.

GitOps’ opinionation was key to its adoption and broad reach of this implementation of the existing pattern within the fast-growing community of Kubernetes practitioners. This was especially important in 2018/2019, as teams were just becoming comfortable with Day 2 operations of Kubernetes, as well as starting to configure continuous delivery for their more critical applications. Weaveworks has done a great job marketing GitOps, promoting the patterns and tools, all while growing a community around both.

In summary…

Is GitOps a panacea? Definitely not but maybe it can help your team. Run an experiment to see.

Can the patterns be implemented with a plethora of tools and platforms? Absolutely!

Is there a community of folks working hard to make tools and patterns, as well as learning from each other to make them better? You betcha. Keep an eye on what they are doing, maybe it’ll be right for you one day. You may learn something that you can implement for your existing CD system.

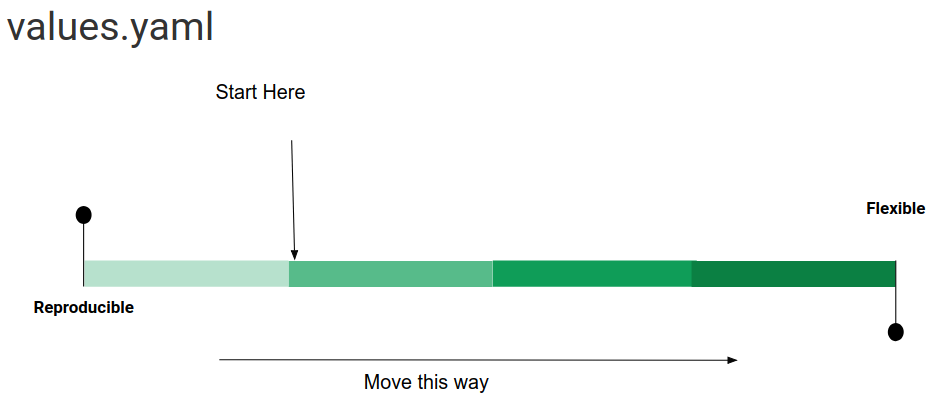
I believe that a key to success for tools in this space is in the opinionation they provide for how you deliver software. These opinions need to be strong enough to get you moving forward with few decisions but flexible enough to fit into your existing systems. If that balance is right, it can accelerate how you build the higher order socio-technical systems that get you more of the DevOps Capabilities that you should be striving for. At the end of the day, you should let teams pick the tools that work best for them.

The underlying truth, however, is that the tools and platforms, GitOps-ified or not, are a small piece of the puzzle. Bryan Liles put it well that GitOps can “multiply your efforts or lack of effort immensely” and that applies not just to GitOps but most new tools you’ll onboard.

If you don’t have some of these key process and cultural capabilities in your organization, it’s going to be harder to improve the reliability and value generation of your software delivery practice:

If you’ve made it this far, thanks for reading my opinions on this topic!

For more, follow me on Twitter @vicnastea.

A while ago, I did a thread for GitOps practitioners to share their pros/cons. Check it out here:

Standard
Uncategorized

Migrating from Docker Compose to Skaffold

Background

Over the last weekend I had occasion to unshelve a Ruby-on-Rails project that I had worked on in 2015. It was a great glimpse into the state of the art of the time. I had chosen some forward leaning but hopefully future-proof tech for the infra side of things. We’d been deploying to Heroku for test and prod environments but leveraged Docker for our development environments.

One of the last few commits to the repo added support for Docker Compose which allowed us to stand up the full stack with a simple command:

  • Ruby-on-Rails single container web app
  • Postgres database
  • Redis for caching

The configuration file (docker-compose.yml) was only about 25 lines that looked like this

web:
  build: .
  command: ./bin/rails server -p 3000 -b 0.0.0.0
  environment:
   REDISCLOUD_URL: redis://redis
   DATABASE_URL: postgres://postgres@db/development
  volumes:
   - .:/myapp
  links:
   - db
   - redis
  ports:
   - "3000:3000"
db:
  image: postgres:9.4.1
  ports:
   - "5432:5432"
redis:
  image: redis
  ports:
   - "6379:6379"

By running the docker-compose up command you could get a reproducible version of the app on your local laptop. I was wary that after 6 years, none of this would work. We all know how much software rots when it isn’t looked after. Much to my surprise the whole stack came up in short order because I had done some work to pin versions of my Ruby environment, Postgresql version and dependencies (Gemfile).

Docker has been a huge leap forward for the ability to nail down a point in time version of a stack like this.

Transition to Continuous Development with Skaffold

With this setup, we had setup Rails to do hot code reloading so that when we changed the business logic on our dev branches it would automatically update in the running app. This was awesome for quickly iterating and testing any changes you were making but when you wanted to update the image or add a dependency you had to stop the running app rebuild the Docker image.

Once I had gotten myself back to the best-of-breed dev setup of 2015, I decided to see what it would take to get a representative environment on the latest and greatest dev tools of today. Obviously I am bit biased, so I turned my attention to figuring out how to port the Docker Compose setup to Skaffold and Minikube.

Many folks are familiar with Minikube, which lets you quickly and efficiently stand up a Kubernetes cluster as either a container running in Docker or a VM running on your machine.

Skaffold is a tool that lets you get a hot-code reloading feel for your apps running on Kubernetes. Skaffold watches your filesystem and as things change it does the right thing to make sure your app is updated as needed. For example, changes to your Dockerfile or any of your app code will cause a rebuild of your container image and it will be redeployed to your minikube cluster.

Below is a diagram showing the before (Docker Compose) and after (Minikube and Skaffold):

The discerning eye will look at these two diagrams and notice that the Kubernetes YAML files are new and that we have a new config file to tell Skaffold how to build and deploy our app.

To create my initial Skaffold configuration all I needed to do was run the skaffold init command which tries to detect the Dockerfiles and Kubernetes YAMLs in my app folder and then lets me pair them up to create my Skaffold YAML file. Since I didn’t yet have Kubernetes YAML, I passed in my Docker Compose file so that Skaffold would also provide me an initial set of Kubernetes manifests.

skaffold init --compose-file docker-compose.yml

Tutorial

In this section I’ll walk you through the same process with a readily available application. In this case, we’ll be using Taiga which is an open source “project management tool for multi-functional agile teams”. I found Taiga by searching on GitHub for docker-compose.yml files to test my procedure with.

If you have a Google account and want to run the tutorial interactively in a free sandbox environment click here:

Open in Cloud Shell
  1. Install Skaffold, Minikube and Kompose. Kompose is used by Skaffold to convert the docker-compose.yml into Kubernetes manifests.
  2. Start minikube.
minikube start

3. Clone the docker-taiga repository which contains the code necessary to get Taiga up and running with Docker Compose.

git clone https://github.com/docker-taiga/taiga
cd taiga

4. The Docker Compose file in docker-taiga doesn’t set ports for all the services which is required for proper discoverability when things are converted to Kubernetes. Apply the following patch to ensure each service exposes its ports properly.

cat > compose.diff <<EOF
diff --git a/docker-compose.yml b/docker-compose.yml
index e09d717..94920c8 100644
--- a/docker-compose.yml
+++ b/docker-compose.yml
@@ -12,0 +13,2 @@ services:
+    ports:
+      - 80:8000
@@ -22,0 +25,2 @@ services:
+    ports:
+      - 80:80
@@ -33,0 +38,2 @@ services:
+    ports:
+      - 80:80
@@ -46,0 +53,2 @@ services:
+    ports:
+      - 5432:5432
@@ -55,0 +64,2 @@ services:
+    ports:
+    - 5672
diff --git a/variables.env b/variables.env
index 4e48c17..8de5b09 100644
--- a/variables.env
+++ b/variables.env
@@ -1 +1 @@
-TAIGA_HOST=taiga.lan
+TAIGA_HOST=localhost
@@ -3 +3 @@ TAIGA_SCHEME=http
-TAIGA_PORT=80
+TAIGA_PORT=4506
EOF
patch -p1 < compose.diff

5. Next, we’ll bring in the source code for one of Taigas components that we want to develop on, in this case the backend. We’ll also set our development branch to the 6.0.1 tag that the Compose File was written for.

git clone https://github.com/taigaio/taiga-back -b 6.0.1

6. Now that we have our source code, Dockerfile, and Compose File, we’ll run skaffold init to generate the skaffold.yaml and Kubernetes manifests.

skaffold init --compose-file docker-compose.yml

Skaffold will ask which Dockerfiles map to the images in the Kubernetes manifests.

The default answers are correct for all questions except the last. Make sure to answer yes (y) when it asks if you want to write out the file.

? Choose the builder to build image dockertaiga/back Docker (taiga-back/docker/Dockerfile)
? Choose the builder to build image dockertaiga/events None (image not built from these sources)
? Choose the builder to build image dockertaiga/front None (image not built from these sources)
? Choose the builder to build image dockertaiga/proxy None (image not built from these sources)
? Choose the builder to build image dockertaiga/rabbit None (image not built from these sources)
? Choose the builder to build image postgres None (image not built from these sources)
apiVersion: skaffold/v2beta12
kind: Config
metadata:
  name: taiga
build:
  artifacts:
  - image: dockertaiga/back
    context: taiga-back/docker
    docker:
      dockerfile: Dockerfile
deploy:
  kubectl:
    manifests:
    - kubernetes/back-claim0-persistentvolumeclaim.yaml
    - kubernetes/back-claim1-persistentvolumeclaim.yaml
    - kubernetes/back-deployment.yaml
    - kubernetes/db-claim0-persistentvolumeclaim.yaml
    - kubernetes/db-deployment.yaml
    - kubernetes/default-networkpolicy.yaml
    - kubernetes/events-deployment.yaml
    - kubernetes/front-claim0-persistentvolumeclaim.yaml
    - kubernetes/front-deployment.yaml
    - kubernetes/proxy-claim0-persistentvolumeclaim.yaml
    - kubernetes/proxy-deployment.yaml
    - kubernetes/proxy-service.yaml
    - kubernetes/rabbit-deployment.yaml
    - kubernetes/variables-env-configmap.yaml

? Do you want to write this configuration to skaffold.yaml? Yes

We’ll also fix an issue with the Docker context configuration that Skaffold interpreted from the Compose File. The taiga-back repo keeps its Dockerfile in a sub-folder rather than the top-level and uses the context from the root. Also

sed -i 's/context:.*/context: taiga-back/' skaffold.yaml
sed -i 's/dockerfile:.*/dockerfile: docker\/Dockerfile/' skaffold.yaml
sed -i 's/name: TAIGA_SECRET/name: TAIGA_SECRET_KEY/' back-deployment.yaml

7. Now we’re ready to run Skaffold’s dev loop to continuously re-build and re-deploy our app as we make changes to the source code. Skaffold will also display the logs of the app and even port-forward important ports to your machine.

You should start to see the backend running the database migrations necessary to start the app and be able to get to the web app via http://localhost:4056

skaffold dev --port-forward

8. To initialize the first user, run the following command in a new terminal and then log in to Taiga with the username admin and password 123123.

kubectl exec deployment/back python manage.py loaddata initial_user

Congrats! You’ve now transitioned your development tooling from Docker Compose to Skaffold and Minikube.

Standard
Kubernetes

Customizing Upstream Helm Charts with Kustomize

Introduction

The Helm charts repository has seen some amazing growth over the last year. We now have over 200 applications that you can install into your Kubernetes clusters with a single command. Along with the growth in the number of applications that are maintained in the Charts repository, there has been huge growth in the number of contributions that are being received. The Charts repo gives the community a place to centralize their understanding of the best practices of how to deploy an application as well which configuration knobs should be available for those applications.

As I mentioned in my talk at Kubecon, these knobs (provided by the Helm values.yaml file) are on a spectrum. You start out on the left and inevitably work your way towards the right:

values

When a chart is first introduced, it is likely to have the use case of its author met. From there, other folks take the chart for a spin and figure out where it could be more flexible in the way its configured so that it can work for their use cases. With the addition of more configuration values, the chart becomes harder to test and reason about as both a user and maintainer. This tradeoff is one that is hard to manage and often ends with charts working their way towards more and more flexible chart values.

A class of changes that we have seen often in the Chart repository is customizations that enable low level changes to Kubernetes manifests to be plumbed through to the values file. Examples of this are:

By now, most of our popular charts allow this flexibility as it has been added by users who need to make these tweaks for the chart to be viable in their environments. The hallmark of these types of values is that they plumb through a K8s API specific configuration to the values.yaml that the user interacts with. At this point, advanced users are happy to be able to tweak what they need but the values.yaml file becomes longer and more confusing to reason about without in-depth Kubernetes knowledge.

There is a good portion of the PRs for upstream charts that are to add these last-mile customizations to charts. While these are very welcome and help others not have to fork or change charts downstream, there is another way to make upstream charts work better in your environment.

Kustomize is a project that came out of the CLI Special interest group. Kustomize “lets you customize raw, template-free YAML files for multiple purposes, leaving the original YAML untouched and usable as is.” So given this functionality of customizing raw Kubernetes YAML, how we can we leverage it for customization of upstream Helm charts?

The answer lies in the helm template command which allows you to use Helms templating and values.yaml parameterization but instead of installing into the cluster just spits out the manifests to standard out. Kustomize can patch our chart’s manifests once they are fully rendered by Helm.

helm-kustomize

Tutorial

So what does this look like in practice? Lets customize the upstream Jenkins chart a bit. While this chart includes tons of ways to parameterize it using the extensive values file, I’ll try to accomplish similar things using the default configuration and Kustomize.

In this example I want to:

  1. Override the default plugins and include the Google Compute Engine plugin
  2. Increase the size of the Jenkins PVC
  3. Bump the memory and CPU made available to Jenkins (it is Java after all)
  4. Set the default password
  5. Ensure that the -Xmx and -Xms flags are passed via the JAVA_OPTS environment variable

Let’s see what the flow would look like:

  1. First, I’ll render the upstream jenkins/chart to a file called jenkins-base.yaml:

    git clone https://github.com/kubernetes/charts.git
    mkdir charts/stable/my-jenkins
    cd charts/stable
    helm template -n ci jenkins > my-jenkins/jenkins-base.yaml
  2. Now I’ll have helm template individually render out the templates I’d like to override

    helm template -n ci jenkins/ -x templates/jenkins-master-deployment.yaml > my-jenkins/master.yaml
    helm template -n ci jenkins/ -x templates/home-pvc.yaml > my-jenkins/home-pvc.yaml
    helm template -n ci jenkins/ -x templates/config.yaml > my-jenkins/config.yaml
  3. Next, I can customize each of these resources to my liking. Note here that anything that is unset in my patched manifests will take the value of the base manifests (jenkins-base.yaml) that come from the chart defaults. The end result can be found in this repo:

    https://github.com/viglesiasce/jenkins-chart-kustomize/tree/master
  4. Once we have the patches we’d like to apply we will tell Kustomize what our layout looks like via the kustomization.yaml file.
    resources:
    - jenkins-base.yaml
    patches:
    - config.yaml
    - home-pvc.yaml
    - master.yaml
  5. Now we can install our customized chart into our cluster.

    cd my-jenkins
    kustomize build | kubectl apply -f -

    I hit an issue here because Helm renders empty resources due to the way that charts enable/disable certain resources from being deployed. Kustomize does not handle these empty resources properly so I had to remove them manually from my jenkins-base.yaml.

  6. Now we can port forward to our Jenkins instance and login at http://localhost:8080 with username admin and password foobar:

    export JENKINS_POD=$(kubectl get pods -l app=ci-jenkins -o jsonpath='{.items[0].metadata.name}')
    kubectl port-forward $JENKINS_POD 8080


  7. Now I can check that my customizations worked. First off, I was able to log in with my custom password. YAY.
    Next, in the Installed Plugins list, I can see that the Google Compute Engine plugin was installed for me. Double YAY.gce-plugin

Tradeoffs

Downsides

So this seems like a great way to customize upstream Helm charts but what am I missing out on by doing this? First, Helm is no longer controlling releases of manifests into the cluster. This means that you cannot use helm rollback or helm list or any of the helm release related commands to manage your deployments. With Helm+Kustomize model, you would do a rollback by reverting your commit and reapplying your previous manifests or by rolling forward to a configuration that works as expected and running your changes through your CD pipeline again.

Helm hooks are a bit wonky in this model since helm template doesn’t know what stage of a release you are currently on, it will dump all the hooks into your manifest. For example, in this example you’ll see that the Jenkins chart includes a test hook Pod that gets created but fails due to the deployment not being ready. Generally test hooks are run out of band of the installation.

Upsides

One of the nice things about this model is that I can now tweak a chart’s implementation without needing to submit the change upstream in order to keep in sync. For example, I can add my bespoke labels and annotations to resources as I see fit. When a chart that I depend on gets updated I can simply re-compute my base using helm template and leave my patches in tact.

Another benefit of using Helm with Kustomize is that I can keep my organization-specific changes separate from the base application. This allows for developers to be able to more clearly see the per-environment changes that are going on as they have less code to parse.

One last benefit is that since release management is no longer handled by Helm, I don’t have to have a Tiller installed and I can use tooling like kubectl, Weave Flux or Spinnaker to manage my deployments.

What’s Next

I’d like to work with the Helm, Charts and Kustomize teams to make this pattern as streamlined as possible. If you have ideas on ways to make these things smoother please reach out via Twitter.

Standard
Kubernetes

Policy-based Image Validation for Kubernetes with Anchore Engine

Introduction

As part of the journey to Kubernetes, you choose a set of Docker images that will house the dependencies needed to run your applications. You may also be using Docker images that were created by third parties to ship off-the-shelf software. Over the last year, the Kubernetes community has worked hard to make it possible to run almost any compute workload. You may now have operational tools such as monitoring and logging systems, as well as any number of databases and caching layers, running in your cluster alongside your application.

Each new use of Kubernetes requires that you vet the images that you will have running inside your cluster. Manual validation and introspection of images may be feasible, albeit tedious, to do for a very small number of images.  However, once you’ve outgrown that, you will need to set up automation to help ensure critical security vulnerabilities, unwanted dependency versions, and undesirable configurations don’t make their way into your clusters.

In the 1.9 release, Kubernetes added beta support for user configurable webhooks that it queries to determine whether a resource should be created. These ValidatingAdmissionWebhooks are a flexible way to dictate what configurations of resources you’d want to allow into your cluster.  To validate the security of your images, you can send each pod creation request to a webhook and return whether the image in the PodSpec adheres to your policies. For example, a naive implementation could allow pod creation only when images come from a set of whitelisted repositories and tags.

For more complicated image policies, you may need a more specialized tool that can gate your pod creation. Anchore Engine is “an open source project that provides a centralized service for inspection, analysis and certification of container images.” With its policy engine you can create and enforce rules for what you consider a production-ready image. As an example, an Anchore policy might check the following things about an image:

  1. No critical package OS vulnerabilities
  2. FROM always uses a tag
  3. Image runs as non-root by default
  4. Certain packages are not installed (ie openssh-server)

Below is a screenshot of these rules in the anchore.io policy editor:

In the next section, I’ll demonstrate how Anchore Engine can be integrated into your Kubernetes clusters to create a ValidatingWebhookConfiguration that runs all images through an Anchore policy check before allowing it into the cluster.

Mechanics of the image validation process

Infrastructure

The image validation process requires a few things to be deployed into your cluster before your policies can be enforced. Below is an architecture diagram of the components involved.

First, you’ll need to deploy Anchore Engine itself into the cluster. This can be achieved by using their Helm chart from the kubernetes/charts repository. Once installed, Anchore Engine is ready to accept requests for images to scan. Anchore doesn’t yet have a native API that Kubernetes can use to request validations. As such, we will create a small service inside of Kubernetes that can proxy requests from the ValidatingWebHookConfiguration.

The process of registering an admission server is relatively straightforward and can be accomplished with a single resource created in the Kubernetes API. Unfortunately, it takes more effort to create the server side process that will receive and respond to the admission request from Kubernetes. Thankfully, the good folks at Openshift have released a library that can be used as a base for creating admission servers. By leveraging the Generic Admission Server, we can reduce the amount of boilerplate in the server process and focus on the logic that we are interested in. In this case, we need to make a few requests to the Anchore Engine API and respond with a pass/fail result when we get back the result of Anchore’s policy check.

For instructions on setting this all up via a Helm chart, head over to the quick start instructions in the Kubernetes Anchore Image Validator repository.

Now that the server logic is handled, you can deploy it into your cluster and configure Kubernetes to start sending any requests to create Pods. With the infrastructure provisioned and ready, let’s take a look at the request path for an invocation to create a deployment in Kubernetes.

Request Flow

As an example, the following happens when a user or controller creates a Deployment:

  1. The Deployment controller creates a ReplicaSet which in turn attempts to create a Pod
  2. The configured ValidatingWebhook controller makes a request to the endpoint passing the PodSpec as the payload.
  3. The Anchore validation controller configured earlier will take that spec, pull out the image references from each container in the Pod and then ask Anchore Engine for a policy result using the Anchore API.
  4. The result is then sent back to Kubernetes.
  5. If the check fails for any of the images, Kubernetes will reject the Pod creation request.

Multi Cluster Policy Management

It is common to have multiple Kubernetes clusters with varying locations, purposes, or sizes. As the number of clusters grows, it can be hard to keep configurations in sync. In the case of the image policy configuration, you can leverage Anchore’s hosted service to serve as the source of truth for all of your clusters’ image policies.

Policy-based Image Validation for Kubernetes with Anchore Engine

Anchore allows you to create, edit, and delete your policies in their hosted user interface, then have the policies pulled down by each of your Anchore Engine services by turning on the policy sync feature. Once policy sync is enabled, Anchore Engine will periodically check with the hosted service to see if any updates to the active policy have been made. These may include new approved images. or the addition/removal of a rule.

What’s Next?

Head over to the Kubernetes Anchore Image Validator repository to check out the code or run the quick start to provision Anchore Engine and the validating web hook in your cluster.

Big thanks to Zach Hill from Anchore for his help in getting things wired up.

Standard
Uncategorized

Porting my brain from Python to Go

Over the past few months, I have made it a goal to get down and dirty with Go. I have been getting more and more involved with Kubernetes lately and feel like its time that I pick up its native language. For the last 6 years, I’ve had Python as my go-to language with Ruby sneaking in when the time is right. I really enjoy Python and feel extremely productive in it. In order to get to some level of comfort with Go I knew that I would have to take a multi-faceted approach to my learning.

Obviously, the first thing I did was just get it installed on my laptop. Being a Mac and Homebrew user, I simply ran: brew install golang. So now I had the toolchain installed and could compile/run things on my laptop. Unfortunately ‘Hello World’ was not going to get me to properly port my existing programming skills into using Go as a primary/native language. I knew enough about Go to know that I need to understand how and why it was built. Additionally, I had been in interpreted language land my whole life (Perl->Python->Ruby) so was taking another leap outside of just changing dialects. At this point I took a step back from just poking at source code to properly study up on the language.

I’ve had a Safari Books Online subscription for quite some time and have leveraged it heavily when learning new technologies. This case was no different. I picked up Programming in Go: Creating Applications for the 21st Century. I found this book to be at the right level for me, existing programming experience but new to Go. I also found that there was enough context as to how to do things the Go way such that I wouldn’t just be writing a bunch of Python in a different language. After a few flights browsing the concepts, I started to read it front to back. At the same time, I found a resource specific to my task at hand, Go for Python Programmers. This was a good way to see the code I was accustomed to writing and how I might write it differently in Go. As I continued reading and studying up, I made sure to pay particular attention when looking at Go code in the wild. The ask of myself was really to understand the code and the idioms, not just glance at it as pseudocode.

There were a few things that I needed some more clarification on after reading through my study materials. I was still confused about how packaging worked in practice. For clarification, my buddy and Go expert Evan Brown pointed me to the Go Build System repository. The thing that clicked for me here was the structure of having a repository of code that is related to each other, splitting out libraries into directories, then using the cmd directory in order to make the binaries that tied things together. This repo also has a great README that shows how they have organized their code. Thanks Go Build Team!

The next thing that I needed to hash out was how exactly I would use my Object Oriented penchant in Go. For this I decided to turn to Go by Example which had a wealth of simple example code for many of the concepts I was grappling with. Things started to click for me after looking at  structsmethods, and interfaces again through a slightly different lens.

Sweet! So now I understood (more or less) how the thing worked but I hadn’t built anything with it. The next phase was figuring out how the rubber met the road and having a concrete task to accomplish with my new tool.

I didn’t have any projects off the top of my head that I could start attacking but remembered that a few moons ago I had signed up for StarFighters, a platform that promised to provide a capture the flag style game that you could code against. I looked back through their site and noticed that their first game, StockFighter, had been released. StockFighter provides a REST API that players can code against in order to manipulate a faux stock market. I didn’t know anything about the stock market but figured this would be as good a task as any to get started. I played through the first few levels by creating a few one off binaries. Then on the harder levels I started to break out my code, create libraries, workers and all kinds of other pieces software to help me complete the tasks that  StockFighter was throwing at me. One huge help in getting me comfortable with creating this larger piece of software was that I had been using Pycharm with the Go plugin. This made code navigation, refactoring, testing and execution familiar.

Shit had gotten real. I was building a thing and feeling more comfortable with each level I played.

After my foray with StockFighter, I felt like I could use a different challenge. It turns out if you start asking around if people need some software built at Google, there will be plenty of people who want to take you up on the offer. The homie Preston was working on an IoT demonstration architecture and needed a widget that could ingest messages from PubSub and then store the data in BigTable. As he explained the project, I told him that it should take me no more than 4 hours to complete the task. I hadn’t use the Go SDKs at the time so I figured that would eat up most of my time. I sat down that afternoon and started the timer. This was the litmus test. I knew it. My brain knew it. My fingers knew it.

I made it happen in just under 5 hours which to me was a damn good effort as I knew that generally estimates are off by 2x. After doing a little cross-compiling magic, I was able to ship Preston a set of binaries for Mac, Linux and Windows that achieved his task.

I’m certainly not done with my journey but I’m happy to have had small successes that make me feel at home with Go.


Standard
Uncategorized

Building a container service with Mesos and Eucalyptus

  marathon-blog
    Over the past few months, I’ve been digging into what it means to work with a distributed container service. Inspired by Werner Vogel’s latest post about ECS, I decided to show an architecture for deploying a container service in Eucalyptus. As part of my investigations into containers, I have looked at the following platforms that provide the ability to manage container based services:
Each of these provide you with a symmetrical (all components run on all hosts) and scalable (hosts can be added after initial deployment) system for hosting your containerized workloads. They also include mechanisms for service discovery and load balancing. Deis and Flynn are both what I would call a “lightweight PaaS” akin to a private Heroku. Mesos, however, is a more flexible and open ended platform, which comes as a blessing and a curse. I was able to deploy many more applications in Mesos but it took me far longer to get a working platform up and running.
     Deis and Flynn are both “batteries included” type systems that once deployed allow you to immediately push your code or container image into the system and have it run your application. Deis and Flynn also install all of their dependencies for you through automated installers. Mesos on the other hand requires you to deploy its prerequisites on your own in order to get going, then requires you to install frameworks on top of it to make it able to schedule and run your applications.
     I wanted to make a Mesos implementation that felt as easy to make useful as Deis and Flynn. I have been working with chef-provisioning to deploy clustered applications for a while now so I figured I would use my previous techniques in order to automate the process of deploying a functional and working N node Mesos/Marathon cluster. Over the last month, I have also been able to play with Mesosphere’s DCOS so was able to get a better idea of what it takes to really make Mesos useful to end users. The “batteries included” version of Mesos is architected as follows:
container-service
Each of the machines in our Mesos cluster will run all of these components, giving us a nice symmetrical architecture for deployment. Mesos and many of its dependencies rely on a working Zookeeper as a distributed key value store. All of the state for the cluster is stored here. Luckily, for this piece of the deployment puzzle I was able to leverage the Chef community’s Exhibitor cookbook which got my ZK cluster up in a snap. Once Zookeeper was deployed, I was able to get my Mesos masters and slaves connected together and was able to see my CPU, memory and disk resources available within the Mesos cluster.
mesos-resources
    Mesos itself does not handle creating applications as services so we need to deploy a service management layer. In my case, I chose Marathon as it is intended to manage long running services like the ones I was most interested in deploying (Elasticsearch, Logstash, Kibana, Chronos). Marathon is run outside of Mesos and acts as the bootstrapper for the rest of the services that we would like to use, our distributed init system.
     Once applications are deployed into Marathon it is necessary to have a mechanism to discover where other services are running. Although it is possible to pin particular services to particular nodes through the Marathon application definition, I would prefer not to have to think about IP addressing in order to connect applications. The preferred method of service discovery in the Mesos ecosystem is to use Mesos DNS and host it as a service in Marathon across all of your nodes. Each slave node can then use itself as a DNS resolver, wherein queries for services  get handled internally and all others are recursed to an upstream DNS server.
     Now that the architecture of the container service is laid out for you, you can get to deploying your stack by heading over to the README. This deployment procedure will not only deploy Mesos+Marathon but will also deploy a full ELK into the cluster to demonstrate connecting various services together in order to provide a higher order one.
Standard
Eucalyptus, QA

EucaLoader: Load Testing Your Eucalyptus Cloud

Locust-full-page

Introduction

After provisioning a cloud that will be used by many users, it is best practice to do load or burn in testing to ensure that it meets your stability and scale requirements. These activities can be performed manually by running commands to run many  instances or create many volumes for example. In order to perform sustained long term tests it is beneficial to have an automated tool that will not only perform the test actions but also allow you to analyze and interpret the results in a simple way.

Background

Over the last year, I have been working with Locust to provide a load testing framework for Eucalyptus clouds. Locust is generally used for load testing web pages but allows for customizable clients which allowed me to hook in our Eutester library in order to generate load. Once I had created my client, I was able to create Locust “tasks” that map to activities on the cloud. Tasks are user interactions like creating a bucket or deleting a volume. Once the tasks were defined I was able to compose them into user profiles that define which types of actions each simulated user will be able to run as well as weighting their probability so that the load can most closely approximate a real world use case. In order to make the deployment of EucaLoader as simple as possible, I have baked the entire deployment into a CloudFormation template. This means that once you have the basics of your deployment done, you can start stressing your cloud and analyzing the results with minimal effort.

Using EucaLoader

Prerequisites

In order to use EucaLoader you will first need to load up an Ubuntu Trusty image into your cloud as follows:

# wget https://cloud-images.ubuntu.com/trusty/current/trusty-server-cloudimg-amd64-disk1.img
# qemu-img convert -O raw trusty-server-cloudimg-amd64-disk1.img trusty-server-cloudimg-amd64-disk1.raw
# euca-install-image -i trusty-server-cloudimg-amd64-disk1.raw -n trusty -r x86_64 -b trusty --virt hvm

We will also need to clone the EucaLoader repository and install its dependencies:

# git clone https://github.com/viglesiasce/euca-loader
# pip install troposphere

Next we will upload credentials for a test account to our objectstore so that our loader can pull them down for Eutester to use:

# euare-accountcreate loader
# euca_conf --get-credentials  loader.zip --cred-account loader
# s3cmd mb s3://loader
# s3cmd put -P loader.zip s3://loader/admin.zip


Launching the stack

Once inside the euca-loader directory we will create our CloudFormation template and then create our stack by passing in the required parameters:

# ./create-locust-cfn-template.py > loader.cfn
# euform-create-stack --template-f loader.cfn  loader -p KeyName=<your-keypair-name> -p CredentialURL='http://<your-user-facing-service-ip>:8773/services/objectstorage/loader/admin.zip' -p ImageID=<emi-id-for-trusty> -p InstanceType=m1.large

At this point you should be able to monitor the stack creation with the following commands

# euform-describe-stacks
# euform-describe-stack-events loader

Once the stack shows as CREATE_COMPLETE, the describe stacks command should show outputs which point you to the Locust web portal (WebPortalUrl) and to your Grafana dashboard for monitoring trends (GrafanaURL).


Starting the tests

In order to start your user simulation, point your web browser to the the WebPortalUrl as defined by the describe stacks output. Once there you can enter the amount of users you’d like to simulate as well as how quickly those users should “hatch”.

Locust-start-test

Once you’ve started the test, the statistics for each type of requests will begin to show up in the Locust dashboard.

Locust-test-running


See your results

In order to better visualize the trends in your results, EucaLoader provides a Grafana dashboard that tracks a few of the requests for various metrics. This dashboard is easily customized to your particular test and is meant as a jumping off point.

Locust-dashboard

Standard
Uncategorized

Introducing HuevOS+RancherOS

huevosArch

Today is an exciting day in Santa Barbara. We are very pleased to introduce our latest innovation to the world of DevOps. 

HuevOS – the Docker-based open-source operating system for tomorrow’s IT and Dev/Ops professional.  HuevOS 1.0 (SunnySide) is the open-source/free-range/gluten-free solution that forms the perfect complement to RancherOS.  In addition, we’re delighted to begin development on our proprietary blend of Services and Language Software as a Service (SaLSaaS) which, when overlayed atop a HuevOS+RancherOS stack, provides a complete and delicious solution around which your whole day can be centered.

Try HuevOS+RancherOS today and let us know which SaLSaaS we should work on first to ensure your hunger for DevOps is quenched thoroughly.  

To get your first taste visit the following repository which includes our Chef Recipe and a Vagrantfile to get you HuevOS in short order:

https://github.com/viglesiasce/huevos-cookbook.git

If you already have your RancherOS host up its easy to add in our HuevOS to the mix via the Docker Registry:

docker pull viglesiasce/huevos; docker run huevos

A huge thank you to all involved in getting us to this point and being able to ship a 1.0 version of the HuevOS+RancherOS platform.

Happy clucking!!

huevOS

Standard
Eucalyptus

Deploying Cassandra and Consul with Chef Provisioning

ConsulCassandra

Introduction

Chef Provisioning (née Chef Metal) is an incredibly flexible way to deploy infrastructure. Its many plugins allow users to develop a single methodology for deploying an application that can then be repeated against many types of infrastructure (AWS, Euca, Openstack, etc). Chef provisioning is especially useful when deploying clusters of machines that make up an application as it allows for machines to be:

  • Staged before deployment
  • Batched for parallelism
  • Deployed in serial when necessary

This level of flexibility means that deploying interesting distributed systems like Cassandra and Consul is a breeze. By leveraging community cookbooks for Consul and Cassandra, we can largely ignore the details of package installation and service management and focus our time on orchestrating the stack in the correct order and configuring the necessary attributes such that our cluster converges properly. For this tutorial we will be deploying:

  • DataStax Cassandra 2.0.x
  • Consul
    • Service discovery via DNS
    • Health checks on a per node basis
  • Consul UI
    • Allows for service health visualization

Once complete we will be able to use Consul’s DNS service to load balance our Cassandra client requests across the cluster as well as use Consul UI in order to keep tabs on our clusters’ health.

In the process of writing up this methodology, I went a step further and created a repository and toolchain for configuring and managing the lifecycle of clustered deployments. The chef-provisioning-recipes repository will allow you to configure your AWS/Euca cloud credentials and images and deploy any of the clustered applications available in the repository.

Steps to reproduce

Install prerequisites

  • Install ChefDK
  • Install package deps (for CentOS 6)
    yum install python-devel gcc git
  • Install python deps:
    easy_install fabric PyYaml
  • Clone the chef-provisioning-recipes repo:
    git clone https://github.com/viglesiasce/chef-provisioning-recipes

Edit config file

The configuration file (config.yml) contains information about how and where to deploy the cluster. There are two main sections in the file:

  1. Profiles
    1. Which credentials/cloud to use
    2. What image to use
    3. What instance type to use
    4. What username to use
  2. Credentials
    1. Cloud endpoints or region
    2. Cloud access and secret keys

Edit the config.yml file found in the repo such that the default profile points to a CentOS 6 image in your cloud and the default credentials point to the proper cloud.

Run the deployment

Once the deployer has been configured we simply need to run it and tell it which cluster we would like to deploy. In this case we’d like to deploy Cassandra so we will run the deployer as follows:

./deployer.py cassandra

This will now automate the following process:

  1. Create a chef repository
  2. Download all necessary cookbooks
  3. Create all necessary instances
  4. Deploy Cassandra and Consul

Once this is complete you should be able to see your instances running in your cloud tagged as follows: cassandra-default-N. In order to access your Consul UI dashboard go to http://instance-pub-ip:8500

You should now also be able to query any of your Consul servers for the IPs of your Cassandra cluster:

nslookup cassandra.service.paas.home &amp;amp;amp;lt;instance-pub-ip&amp;amp;amp;gt;

In order to tear down the cluster simply run:

./deployer.py cassandra --op destroy
Standard