Introduction
Background
Using EucaLoader
Prerequisites
In order to use EucaLoader you will first need to load up an Ubuntu Trusty image into your cloud as follows:
# wget https://cloud-images.ubuntu.com/trusty/current/trusty-server-cloudimg-amd64-disk1.img

# qemu-img convert -O raw trusty-server-cloudimg-amd64-disk1.img trusty-server-cloudimg-amd64-disk1.raw

# euca-install-image -i trusty-server-cloudimg-amd64-disk1.raw -n trusty -r x86_64 -b trusty --virt hvm
We will also need to clone the EucaLoader repository and install its dependencies:
# git clone https://github.com/viglesiasce/euca-loader

# pip install troposphere
Next we will upload credentials for a test account to our objectstore so that our loader can pull them down for Eutester to use:
# euare-accountcreate loader

# euca_conf --get-credentials  loader.zip --cred-account loader

# s3cmd mb s3://loader

# s3cmd put -P loader.zip s3://loader/admin.zip
Launching the stack
Once inside the euca-loader directory we will create our CloudFormation template and then create our stack by passing in the required parameters:
# ./create-locust-cfn-template.py > loader.cfn

# euform-create-stack --template-f loader.cfn  loader -p KeyName=<your-keypair-name> -p CredentialURL='http://<your-user-facing-service-ip>:8773/services/objectstorage/loader/admin.zip' -p ImageID=<emi-id-for-trusty> -p InstanceType=m1.large
At this point you should be able to monitor the stack creation with the following commands
# euform-describe-stacks

# euform-describe-stack-events loader
Once the stack shows as CREATE_COMPLETE, the describe stacks command should show outputs which point you to the Locust web portal (WebPortalUrl) and to your Grafana dashboard for monitoring trends (GrafanaURL).
Starting the tests
In order to start your user simulation, point your web browser to the the WebPortalUrl as defined by the describe stacks output. Once there you can enter the amount of users you’d like to simulate as well as how quickly those users should “hatch”.

Once you’ve started the test, the statistics for each type of requests will begin to show up in the Locust dashboard.

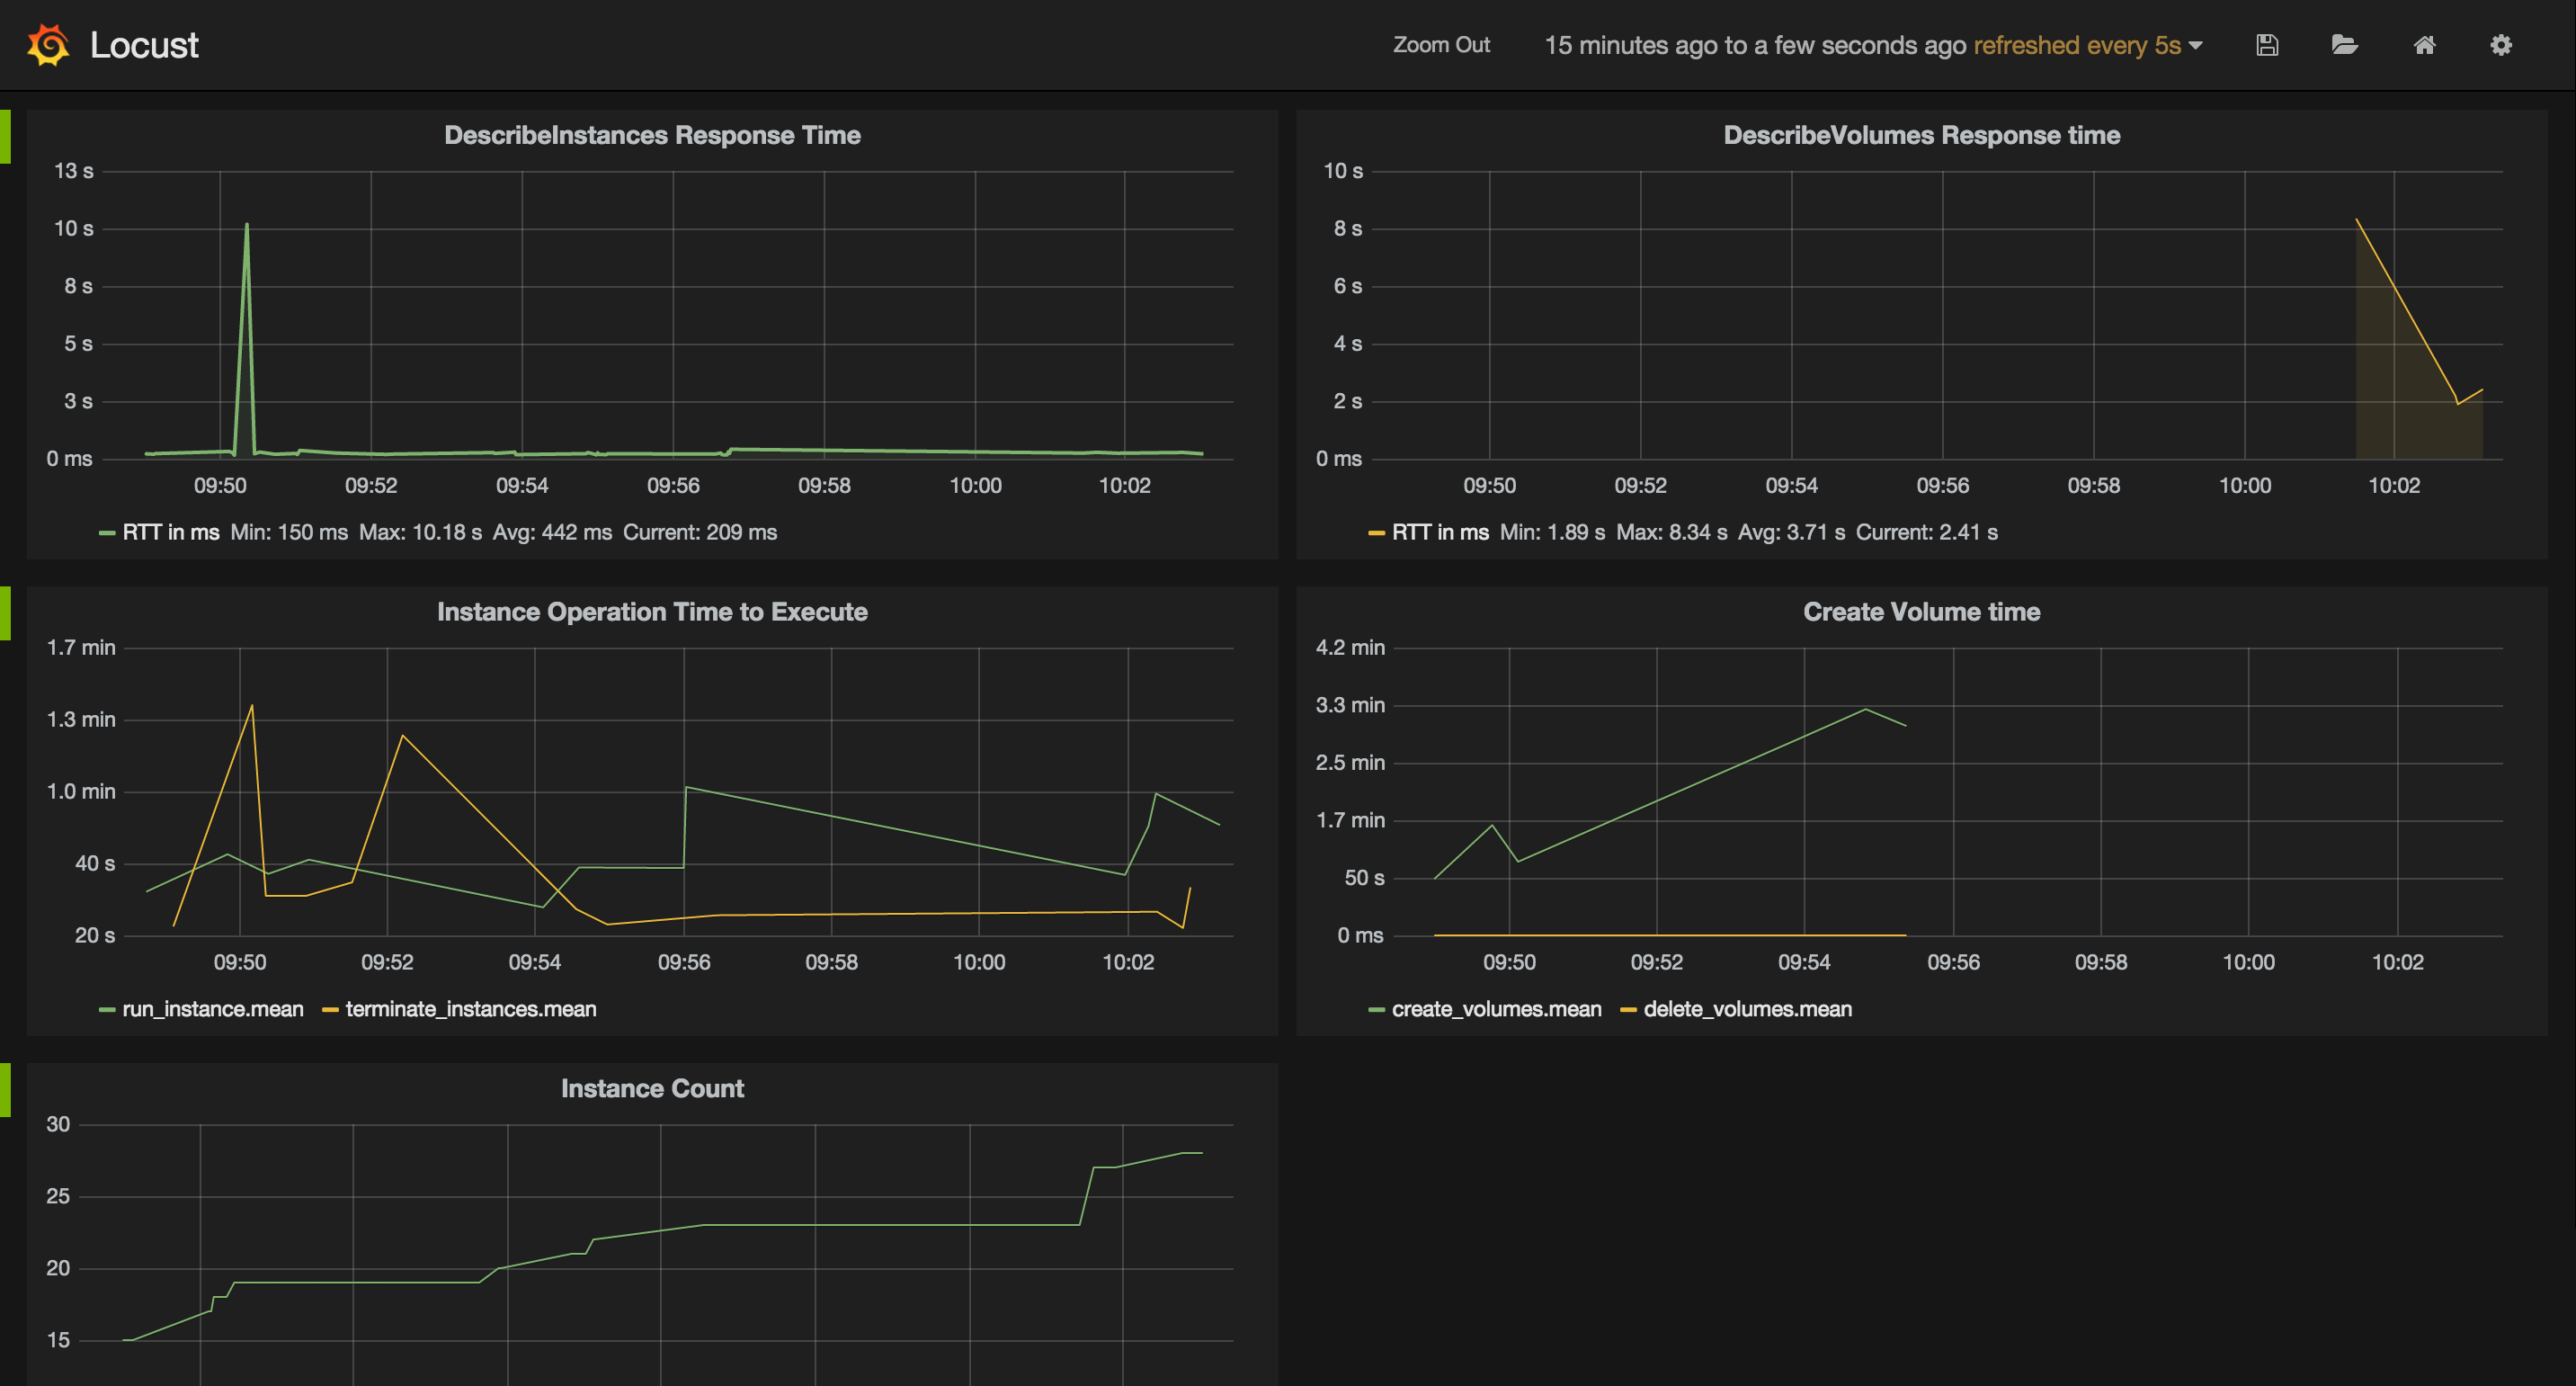
See your results
In order to better visualize the trends in your results, EucaLoader provides a Grafana dashboard that tracks a few of the requests for various metrics. This dashboard is easily customized to your particular test and is meant as a jumping off point.